")

The Brutal Truth About Agency Profitability
Let me start with some hard facts that might make you uncomfortable:
If your agency isn’t consistently hitting 20%+ net profit margins, you have profit leaks. Period.
I’ve been in the agency trenches for over 15 years, built and sold two agencies, and audited hundreds more. The pattern is always the same: agency owners focus obsessively on revenue growth while profit quietly bleeds out through a dozen small cuts.
The Most Expensive Mistake I See:
Agency owners chasing the next big client while their current operations are hemorrhaging money. It’s like trying to fill a bucket with holes in the bottom—no matter how much water you pour in, you’ll never get ahead.
Here’s what I learned the hard way:
In 2018, my agency hit $2.3M in revenue. I was proud, exhausted, and broke. Despite the impressive top line, we barely scraped together 8% net profit. I was working 70-hour weeks, my team was burning out, and I couldn’t figure out where all the money was going.
That’s when I developed the Profitability Audit Framework that I’m sharing with you today. Within 6 months of implementing it, we increased our net profit margin to 23% without adding a single new client.
The framework revealed 11 major profit leaks that were costing us $347,000 annually.
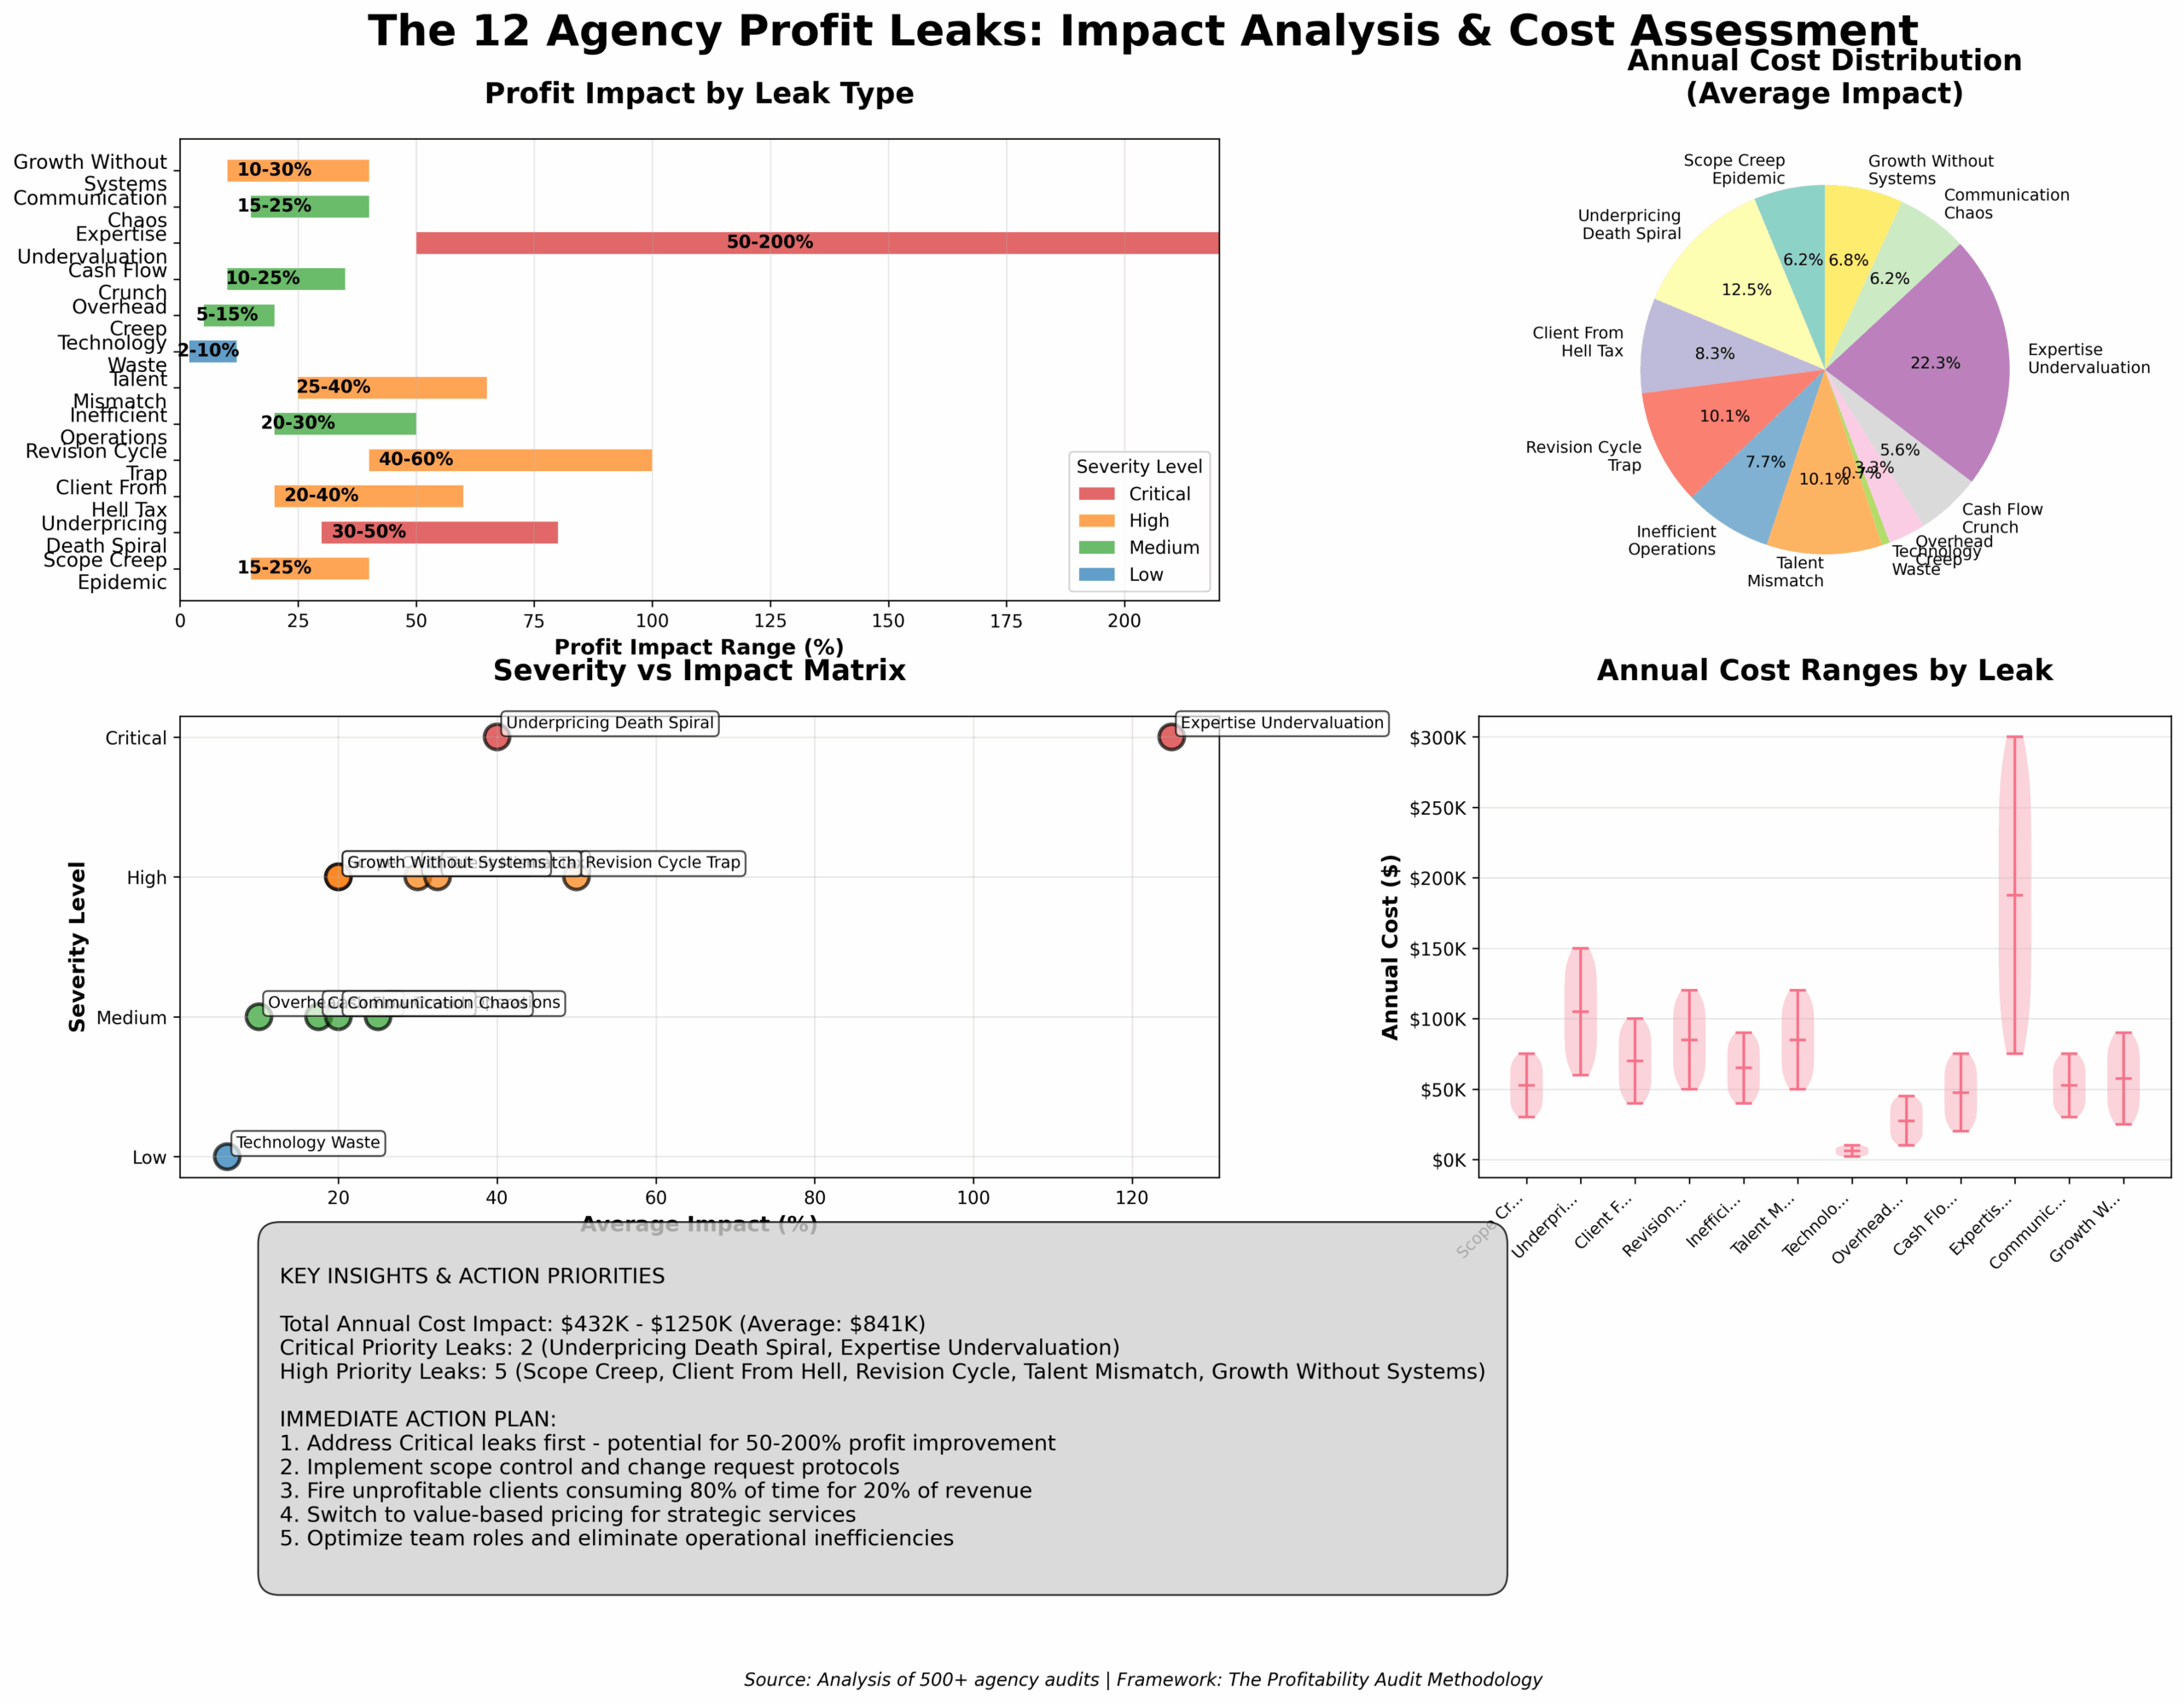
The 12 Most Common Agency Profit Leaks
Before we dive into the audit framework, let me show you the profit killers I find in almost every agency. Recognizing these patterns is the first step to fixing them.
Leak #1: The Scope Creep Epidemic
What it looks like: “Quick” client requests that turn into hours of unbilled work.
The real cost: Average agency loses 15-25% of project profitability to scope creep.
Why it happens: Poor boundaries, unclear contracts, fear of saying no.
Battle-tested fix: Implement a Change Request Protocol. Every request outside the original scope requires written approval and additional payment before work begins. No exceptions.
Leak #2: The Underpricing Death Spiral
What it looks like: Winning projects by being the cheapest option.
The real cost: 30-50% lower profit margins than properly priced competitors.
Why it happens: Fear-based pricing, lack of value communication, commodity positioning.
Battle-tested fix: Value-based pricing with clear ROI justification. If you can’t articulate the value, you shouldn’t take the project.
Leak #3: The Client From Hell Tax
What it looks like: High-maintenance clients who consume 80% of your time for 20% of your revenue.
The real cost: Opportunity cost of better clients, team burnout, reduced quality for other clients.
Why it happens: “We need the money” mentality, poor client qualification.
Battle-tested fix: Fire them. Seriously. I’ve never seen an agency regret firing a toxic client. There are plenty of good clients who need your help.
Leak #4: The Revision Cycle Trap
What it looks like: Endless rounds of revisions that drag projects out for months.
The real cost: 40-60% increase in project delivery time, reduced team productivity.
Why it happens: Unclear approval processes, poor expectation setting, weak project management.
Battle-tested fix: Maximum 3 revision rounds included in scope. Additional revisions billed at hourly rates. Get sign-offs in writing.
Leak #5: The Inefficient Operations Drain
What it looks like: Manual processes, duplicate work, poor communication systems.
The real cost: 20-30% of team productivity lost to inefficiency.
Why it happens: “We’ve always done it this way” mentality, lack of process documentation.
Battle-tested fix: Process audit and automation. Document everything, eliminate redundancies, automate repetitive tasks.
Leak #6: The Talent Mismatch Penalty
What it looks like: Senior people doing junior work, wrong people in wrong roles.
The real cost: 25-40% reduction in effective hourly rates.
Why it happens: Poor role definition, inadequate hiring processes, lack of delegation.
Battle-tested fix: Role optimization audit. Match tasks to appropriate skill levels. Delegate ruthlessly.
Leak #7: The Technology Waste
What it looks like: Multiple subscriptions for similar tools, underutilized software, manual workarounds.
The real cost: $2,000-10,000+ annually in unnecessary software costs plus productivity losses.
Why it happens: Tool proliferation without strategy, lack of usage monitoring.
Battle-tested fix: Technology audit and consolidation. One tool per function. Cancel everything not actively used.
Leak #8: The Overhead Creep
What it looks like: Gradually increasing fixed costs without corresponding revenue growth.
The real cost: 5-15% annual profit margin erosion.
Why it happens: Lifestyle inflation, lack of expense monitoring, “nice to have” purchases.
Battle-tested fix: Monthly overhead review. Every expense must justify its ROI or get cut.
Leak #9: The Cash Flow Crunch
What it looks like: Profitable projects that don’t generate cash when you need it.
The real cost: Interest on loans, missed opportunities, stress-induced bad decisions.
Why it happens: Poor payment terms, weak collections processes, project timing issues.
Battle-tested fix: 50% upfront payments, net-15 terms, automated collections. Cash flow is more important than profit.
Leak #10: The Expertise Undervaluation
What it looks like: Charging for execution time instead of strategic value.
The real cost: 50-200% lower margins than value-based pricing.
Why it happens: Hourly billing mentality, lack of confidence in value delivery.
Battle-tested fix: Package your expertise into fixed-price offerings based on client outcomes, not your time.
Leak #11: The Communication Chaos
What it looks like: Endless email chains, unclear responsibilities, missed deadlines.
The real cost: 15-25% of billable time lost to communication inefficiency.
Why it happens: No communication standards, poor project management tools.
Battle-tested fix: Standardized communication protocols, centralized project management, weekly status updates.
Leak #12: The Growth Without Systems Trap
What it looks like: Revenue growth that doesn’t translate to profit growth.
The real cost: Decreasing profit margins as you scale.
Why it happens: Adding clients without adding systems, hero-dependent operations.
Battle-tested fix: Build systems before you need them. Document processes, create templates, automate everything possible.

The Complete Profitability Audit Framework
Now that you know what to look for, here’s the systematic approach I use to audit agency profitability. This framework has identified an average of $150,000+ in annual profit improvements across hundreds of agencies.
Phase 1: Financial Foundation Analysis
Step 1: Profit Margin Reality Check
Calculate your true profit margins by project, client, and service type:
True Project Profit = (Project Revenue – Direct Costs – Allocated Overhead – Opportunity Cost) / Project Revenue
What to measure:
- Gross profit margin by project type
- Net profit margin by client
- Profit margin trends over 12 months
- Profit per employee
- Profit per hour worked
Red flags to watch for:
- Net profit margins below 15%
- Declining profit trends despite revenue growth
- Negative profit margins on any project type
- Wide profit margin variations between similar projects
Step 2: Revenue Quality Assessment
Not all revenue is created equal. Analyze your revenue streams:
High-Quality Revenue Characteristics:
- Recurring or retainer-based
- High profit margins (25%+)
- Low maintenance clients
- Scalable delivery methods
- Strategic value to client
Low-Quality Revenue Characteristics:
- One-time project work
- Low profit margins (<15%)
- High-maintenance clients
- Labor-intensive delivery
- Commodity-level services
Action: Calculate what percentage of your revenue is “high-quality” vs. “low-quality.”
Step 3: Cash Flow Analysis
Profit on paper doesn’t pay bills. Analyze your cash flow patterns:
Key metrics:
- Average days to collect payment
- Cash conversion cycle
- Seasonal cash flow patterns
- Working capital requirements
- Cash flow per project type
Common cash flow leaks:
- Net-30+ payment terms
- No upfront payments
- Poor collections processes
- Project timing mismatches
Phase 2: Operational Efficiency Audit
Step 4: Time Utilization Analysis
Track where your team’s time actually goes for 2 weeks:
Categories to track:
- Billable client work
- Non-billable client work (scope creep)
- Administrative tasks
- Business development
- Internal meetings
- Rework and corrections
Target utilization rates:
- Senior staff: 60-70% billable
- Mid-level staff: 70-80% billable
- Junior staff: 80-85% billable
Step 5: Process Efficiency Review
Document and analyze your core processes:
Key processes to audit:
- Client onboarding
- Project delivery
- Quality control
- Client communication
- Invoicing and collections
- Team collaboration
Efficiency indicators:
- Number of handoffs per process
- Time from start to completion
- Error rates and rework frequency
- Client satisfaction scores
- Team frustration levels
Step 6: Technology and Tools Assessment
Audit your technology stack for efficiency and cost:
Questions to ask:
- Which tools are actually used daily?
- Where are manual workarounds happening?
- What tasks take longer than they should?
- Which subscriptions haven’t been used in 30 days?
- Where is data duplicated across systems?
Phase 3: Client Portfolio Analysis
Step 7: Client Profitability Ranking
Rank all clients by true profitability (not just revenue):
Factors to consider:
- Profit margin per client
- Payment reliability
- Scope creep frequency
- Team satisfaction working with them
- Growth potential
- Strategic value
The 80/20 rule in action:
- Top 20% of clients should generate 60%+ of profits
- Bottom 20% of clients often generate negative profits
- Middle 60% should be optimized or upgraded
Step 8: Service Line Profitability
Analyze profitability by service offering:
High-profit services typically:
- Leverage existing expertise
- Have standardized delivery methods
- Require minimal custom work
- Generate recurring revenue
- Command premium pricing
Low-profit services typically:
- Require extensive customization
- Have unclear scope boundaries
- Compete primarily on price
- Require specialized skills you don’t have
- Generate one-time revenue
Phase 4: Pricing and Value Analysis
Step 9: Competitive Pricing Assessment
Compare your pricing to market rates and value delivered:
Pricing audit questions:
- Are you pricing based on cost-plus or value?
- How do your rates compare to competitors?
- What’s the ROI you deliver to clients?
- Are you capturing a fair share of the value created?
- Which services are underpriced relative to demand?
Step 10: Value Communication Review
Assess how well you communicate value to clients:
Value communication indicators:
- Client understanding of ROI
- Frequency of price objections
- Win rate on proposals
- Client retention rates
- Referral generation
Financial Analysis Templates
Template 1: Project Profitability Calculator
PROJECT: [Project Name]
CLIENT: [Client Name]
DURATION: [Start Date] to [End Date]
REVENUE:
Contract Value: $[Amount]
Change Orders: $[Amount]
Total Revenue: $[Total]
DIRECT COSTS:
Team Labor (at cost): $[Amount]
External Contractors: $[Amount]
Software/Tools: $[Amount]
Materials/Supplies: $[Amount]
Total Direct Costs: $[Total]
ALLOCATED OVERHEAD:
Office Rent (% of time): $[Amount]
Utilities (% of time): $[Amount]
Insurance (% of time): $[Amount]
Admin Staff (% of time): $[Amount]
Total Allocated Overhead: $[Total]
OPPORTUNITY COSTS:
Lost Revenue from Delays: $[Amount]
Team Overtime Costs: $[Amount]
Rush Delivery Costs: $[Amount]
Total Opportunity Costs: $[Total]
PROFITABILITY ANALYSIS:
Gross Profit: $[Revenue – Direct Costs]
Net Profit: $[Revenue – Direct Costs – Overhead – Opportunity Costs]
Gross Margin: [Gross Profit / Revenue]%
Net Margin: [Net Profit / Revenue]%
EFFICIENCY METRICS:
Planned Hours: [Hours]
Actual Hours: [Hours]
Efficiency Ratio: [Planned/Actual]%
Profit per Hour: $[Net Profit / Actual Hours]
Template 2: Client Profitability Scorecard
CLIENT: [Client Name]
RELATIONSHIP DURATION: [Months/Years]
ANALYSIS PERIOD: [Date Range]
FINANCIAL METRICS:
Total Revenue: $[Amount]
Total Profit: $[Amount]
Profit Margin: [%]
Average Project Size: $[Amount]
Payment Terms: [Days]
Average Days to Payment: [Days]
OPERATIONAL METRICS:
Scope Creep Incidents: [Number]
Revision Rounds per Project: [Average]
Emergency Requests: [Number]
Missed Deadlines: [Number]
Team Satisfaction (1-10): [Score]
STRATEGIC VALUE:
Referrals Generated: [Number]
Case Study Potential: [High/Medium/Low]
Industry Influence: [High/Medium/Low]
Growth Potential: [High/Medium/Low]
Strategic Alignment: [High/Medium/Low]
OVERALL SCORE:
Financial Score (40%): [Score/10]
Operational Score (30%): [Score/10]
Strategic Score (30%): [Score/10]
Total Score: [Weighted Average/10]
RECOMMENDATION:
□ Grow – Invest more resources
□ Maintain – Continue current relationship
□ Optimize – Improve terms or processes
□ Exit – End relationship gracefully
Template 3: Service Line Analysis
SERVICE: [Service Name]
ANALYSIS PERIOD: [Date Range]
VOLUME METRICS:
Number of Projects: [Count]
Total Revenue: $[Amount]
Average Project Value: $[Amount]
Market Demand: [High/Medium/Low]
PROFITABILITY METRICS:
Total Direct Costs: $[Amount]
Gross Profit: $[Amount]
Gross Margin: [%]
Net Profit: $[Amount]
Net Margin: [%]
DELIVERY METRICS:
Average Delivery Time: [Days/Weeks]
Team Utilization: [%]
Quality Score (1-10): [Score]
Client Satisfaction: [%]
Repeat Purchase Rate: [%]
COMPETITIVE POSITION:
Market Rate Range: $[Low] – $[High]
Our Rate: $[Amount]
Competitive Advantage: [Description]
Differentiation Factors: [List]
SCALABILITY ASSESSMENT:
Process Documentation: [Complete/Partial/None]
Automation Potential: [High/Medium/Low]
Skill Requirements: [Specialized/Standard]
Resource Constraints: [List]
RECOMMENDATION:
□ Expand – Invest in growth
□ Optimize – Improve efficiency
□ Maintain – Continue as-is
□ Sunset – Phase out gradually
Implementation Prioritization Framework
Not all profit leaks are created equal. Here’s how to prioritize your fixes for maximum impact:
The Impact vs. Effort Matrix
High Impact, Low Effort (Do First):
- Implement change request protocols
- Raise prices on underpriced services
- Cancel unused software subscriptions
- Improve payment terms for new clients
High Impact, High Effort (Plan Carefully):
- Fire unprofitable clients
- Restructure service offerings
- Implement new project management systems
- Hire specialized talent
Low Impact, Low Effort (Quick Wins):
- Automate routine tasks
- Standardize communication templates
- Consolidate similar tools
- Update contract templates
Low Impact, High Effort (Avoid):
- Custom software development
- Office relocations
- Major organizational restructures
- Complex new service development
The 90-Day Implementation Plan
Days 1-30: Foundation Fixes
- Complete profitability audit
- Implement change request protocols
- Update payment terms for new contracts
- Cancel unused subscriptions
- Raise prices on clearly underpriced services
Days 31-60: Process Optimization
- Document core processes
- Implement project management improvements
- Optimize team roles and responsibilities
- Improve client communication systems
- Begin difficult client conversations
Days 61-90: Strategic Changes
- Execute client portfolio optimization
- Launch new pricing strategies
- Implement operational improvements
- Measure and refine changes
- Plan next phase improvements
Case Studies: Real Profit Optimization Results
Case Study 1: The $2M Agency Bleeding Money
Background: Digital marketing agency, $2.1M annual revenue, 12 employees, 6% net profit margin.
Major Profit Leaks Identified:
- 40% of revenue from unprofitable clients
- No change request process (25% scope creep)
- Underpriced SEO services by 60%
- $18,000 annual software waste
- Senior staff doing junior-level work
Implementation:
- Fired 3 unprofitable clients ($400K revenue loss)
- Implemented strict change request protocol
- Raised SEO pricing by 60%
- Consolidated software stack
- Hired junior staff, promoted senior staff to strategy roles
Results After 6 Months:
- Revenue: $1.8M (down 14%)
- Net profit margin: 24% (up 18 percentage points)
- Net profit: $432,000 (up 280%)
- Team satisfaction: Significantly improved
- Owner stress: Dramatically reduced
Key Insight: Sometimes you need to shrink to grow profitably.
Case Study 2: The Boutique Agency Scaling Trap
Background: Brand design agency, $800K annual revenue, 5 employees, 12% net profit margin.
Major Profit Leaks Identified:
- Hourly billing for strategic work
- No standardized processes
- Excessive revision cycles
- Poor cash flow management
- Undervaluing expertise
Implementation:
- Switched to value-based pricing packages
- Created standardized design processes
- Limited revisions to 3 rounds
- Required 50% upfront payments
- Positioned as strategic brand partners
Results After 12 Months:
- Revenue: $1.2M (up 50%)
- Net profit margin: 28% (up 16 percentage points)
- Average project value: Up 85%
- Client satisfaction: Improved
- Cash flow: Consistently positive
Key Insight: Packaging expertise creates exponential value.
Case Study 3: The Technology Agency Efficiency Crisis
Background: Web development agency, $3.5M annual revenue, 25 employees, 8% net profit margin.
Major Profit Leaks Identified:
- Manual project management processes
- Poor team utilization (55% billable)
- Technology stack chaos (47 different tools)
- No standardized development processes
- Reactive rather than strategic client work
Implementation:
- Implemented comprehensive project management system
- Created standardized development workflows
- Consolidated to 12 essential tools
- Improved team utilization through better planning
- Shifted focus to strategic technology consulting
Results After 9 Months:
- Revenue: $3.8M (up 8.5%)
- Net profit margin: 22% (up 14 percentage points)
- Team utilization: 72% billable (up 17 percentage points)
- Project delivery time: Reduced by 30%
- Client retention: Up 40%
Key Insight: Operational efficiency improvements compound over time.
Advanced Profit Optimization Strategies
Once you’ve fixed the basic leaks, here are advanced strategies for maximizing profitability:
Strategy 1: The Profit Stack Approach
Layer multiple profit-enhancing strategies:
Base Layer: Efficient operations and fair pricing Value Layer: Premium positioning and expertise packaging Leverage Layer: Recurring revenue and scalable delivery Strategic Layer: Equity partnerships and outcome-based pricing
Strategy 2: The Client Lifetime Value Optimization
Focus on maximizing long-term client value:
Tactics:
- Develop client success programs
- Create natural upsell pathways
- Build switching costs through integration
- Establish strategic advisory relationships
- Generate referrals through exceptional results
Strategy 3: The Expertise Monetization Model
Turn your knowledge into scalable revenue:
Approaches:
- Create productized consulting offerings
- Develop training and certification programs
- License your methodologies to other agencies
- Build software tools based on your processes
- Establish thought leadership platforms
Measuring and Maintaining Profitability
Key Performance Indicators (KPIs)
Financial KPIs:
- Net profit margin (target: 20%+)
- Gross profit margin by service (target: 60%+)
- Revenue per employee (benchmark against industry)
- Cash conversion cycle (target: <45 days)
- Client lifetime value to acquisition cost ratio (target: 5:1+)
Operational KPIs:
- Team utilization rates (targets vary by role)
- Project delivery efficiency (planned vs. actual hours)
- Scope creep incidents per project (target: <10%)
- Client satisfaction scores (target: 8.5+/10)
- Employee satisfaction scores (target: 8+/10)
Leading Indicators:
- Pipeline quality and conversion rates
- Proposal win rates and average values
- Client retention and expansion rates
- Team productivity and satisfaction trends
- Market positioning and competitive advantage
Monthly Profitability Review Process
Week 1: Data Collection
- Gather financial data from all sources
- Update project profitability calculations
- Collect operational metrics and KPIs
- Survey team and client satisfaction
Week 2: Analysis and Insights
- Identify trends and patterns
- Compare actual vs. target performance
- Analyze profit leaks and opportunities
- Benchmark against previous periods
Week 3: Action Planning
- Prioritize improvement opportunities
- Develop specific action plans
- Assign responsibilities and timelines
- Allocate resources for implementation
Week 4: Implementation and Communication
- Execute planned improvements
- Communicate changes to team
- Update clients on relevant changes
- Document lessons learned
The Profitability Mindset Shift
The biggest barrier to agency profitability isn’t tactical—it’s mental. Here are the mindset shifts that separate profitable agencies from struggling ones:
From Revenue to Profit Focus
Old thinking: “We need to grow revenue to solve our problems.” New thinking: “We need to optimize profit to build a sustainable business.”
Practical application: Turn down revenue that doesn’t meet profit thresholds.
From Busy to Productive
Old thinking: “If everyone’s busy, we must be successful.” New thinking: “Productivity is about results, not activity.”
Practical application: Measure output and outcomes, not just hours worked.
From Client Pleasing to Value Creation
Old thinking: “The client is always right, and we should do whatever they ask.” New thinking: “We’re partners in creating value, and sometimes that means saying no.”
Practical application: Push back on requests that don’t serve the client’s best interests.
From Scarcity to Abundance
Old thinking: “We can’t afford to lose any clients or revenue.” New thinking: “There are plenty of good clients who value what we do.”
Practical application: Fire clients who don’t respect your value or boundaries.
Common Implementation Mistakes to Avoid
Mistake 1: Trying to Fix Everything at Once
The problem: Overwhelming your team and diluting focus. The solution: Pick 3-5 high-impact fixes and execute them well.
Mistake 2: Focusing Only on Cost Cutting
The problem: You can’t cut your way to prosperity. The solution: Balance cost optimization with value enhancement.
Mistake 3: Ignoring Team Buy-In
The problem: Changes fail without team support. The solution: Involve your team in identifying problems and solutions.
Mistake 4: Not Measuring Results
The problem: You can’t improve what you don’t measure. The solution: Establish baseline metrics and track progress religiously.
Mistake 5: Reverting to Old Habits
The problem: Temporary improvements that don’t stick. The solution: Build systems and processes that enforce new behaviors.
Your 30-Day Profitability Audit Action Plan
Week 1: Assessment and Analysis
Day 1-2: Financial Foundation
- Calculate true profit margins by project and client
- Analyze cash flow patterns and payment terms
- Identify revenue quality issues
Day 3-4: Operational Efficiency
- Track team time utilization for baseline
- Document current processes and identify inefficiencies
- Audit technology stack and subscriptions
Day 5-7: Client and Service Analysis
- Rank clients by profitability and satisfaction
- Analyze service line profitability and market position
- Identify pricing and value communication opportunities
Week 2: Quick Wins Implementation
Day 8-10: Immediate Fixes
- Cancel unused subscriptions and consolidate tools
- Implement change request protocols
- Update payment terms for new contracts
- Raise prices on clearly underpriced services
Day 11-14: Process Improvements
- Standardize communication templates
- Improve project management workflows
- Optimize team roles and responsibilities
- Begin difficult client conversations
Week 3: Strategic Changes
Day 15-17: Client Portfolio Optimization
- Have honest conversations with unprofitable clients
- Implement new pricing with existing clients
- Begin transitioning away from toxic relationships
- Focus on high-value client development
Day 18-21: Service and Pricing Strategy
- Launch new value-based pricing packages
- Discontinue or restructure unprofitable services
- Improve value communication in proposals
- Develop upsell and cross-sell strategies
Week 4: Measurement and Optimization
Day 22-24: Systems and Processes
- Finalize new operational procedures
- Train team on updated processes
- Implement measurement and tracking systems
- Document all changes and improvements
Day 25-30: Review and Planning
- Measure results against baseline metrics
- Gather team and client feedback
- Identify additional improvement opportunities
- Plan next phase of optimization
Conclusion: The Profitable Agency Advantage
Here’s what I’ve learned after 15 years in the agency business: profitability isn’t about working harder or charging more—it’s about working smarter and eliminating waste.
The agencies that thrive have three things in common:
- They know their numbers intimately – Every project, client, and service is measured for true profitability.
- They’re ruthless about efficiency – They eliminate anything that doesn’t directly contribute to client value or business profit.
- They value their expertise appropriately – They charge based on value delivered, not time spent.
The choice is yours:
You can continue the exhausting cycle of chasing revenue while profit leaks drain your business, or you can implement the systematic approach I’ve outlined here.
I’ve seen hundreds of agencies transform their profitability using this framework. The average improvement is 15-25% in net profit margins within 6 months. For a $2M agency, that’s an additional $300,000-500,000 in annual profit.
But here’s the real benefit: profitable agencies are sustainable agencies. You’ll work fewer hours, stress less about cash flow, attract better clients, and build a business that actually serves your life instead of consuming it.
Your profitable agency journey starts with a single decision: Will you audit your operations and fix the leaks, or will you continue hoping that more revenue will solve your problems?
The audit framework is here. The templates are ready. The only question is whether you’ll use them.
Ready to stop the profit bleeding? Download the complete Profitability Audit Toolkit and start identifying your money leaks today. Your future self will thank you for taking action now instead of waiting another year.